
At Wildcat Digital, we have PPC experts who try to keep jargon to a minimum when explaining performance to clients. Although our priority is building and maintaining your campaigns, another part of our job is ensuring that you understand the how and why behind our decision-making. In this article, our aim is to help you understand what the figures in your reports and dashboards actually mean. But first, let’s establish what some of the main KPIs of PPC actually are:
The key KPIs in PPC that help you understand how your campaign is performing include:
- Reach, Impressions & Frequency
- CPC
- CPM
- CTR
- CPA
- Search Impression Share
- Conversion Rate
- ROAS
Continue reading to find out what these acronyms and metrics actually mean and how they can be utilised to measure a campaign’s success.

What are KPIs in PPC?
A KPI (or Key Performance Indicator) indicates how well your campaigns are performing in relation to the overarching goals of your business. Your KPIs will be unique to your business depending on what you consider to be a success.
If you’ve not set up a KPI before, they should follow SMART guidelines – Specific, Measurable, Achievable, Relevant and Time-Bound.
As an example, an eCommerce start-up may have a KPI to increase the total number of online sales by 300% by Q3 of the year.
Another example may be a well-established, nationwide company that has the KPI to improve customer retention by 30% in the next 6 months.
Why Track PPC Campaign KPIs?
Tracking the KPIs in your PPC campaigns allows you to gauge the effectiveness of your strategy, and make decisions that are data-driven.
Monitoring your KPIs on a regular basis allows you to consistently identify the areas in need of improvement and optimise your strategies accordingly.
The PPC KPIs You Need to Know
When running a PPC campaign, there are a variety of metrics and KPIs that will help you to understand how the campaign is performing, and what you can do to improve performance. Here are the key metrics to look at.
Reach, Impressions & Frequency
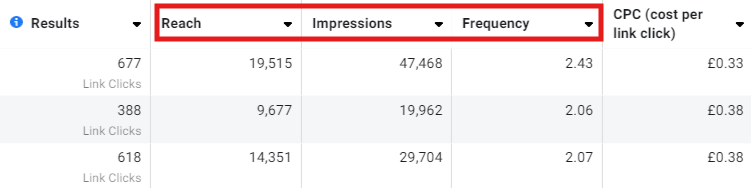
Reach refers to the total number of unique users who have seen your ad. This is important for understanding the size of your potential audience and helps gauge whether you’re successfully reaching new customers. For brand awareness campaigns, maximising reach is often a key objective. Monitoring reach ensures your targeting is broad enough, and a high reach with low engagement can indicate that your targeting might need refining.
Impressions, on the other hand, track how many times your ad is displayed, regardless of whether it was clicked. Impressions measure your ad’s visibility and are important for campaigns focused on brand exposure or retargeting. However, if impressions are high but clicks or conversions are low, it may be a sign of ad fatigue. In this case, rotating ad creatives or adjusting your targeting could help refresh audience interest.
Frequency measures the average number of times a unique user sees your ad. While repeated exposure can improve brand recall, showing the ad too often can lead to diminishing returns and even annoy your audience. If your frequency is too high and engagement is dropping, it may be time to change up your ads or refine your targeting
Meta Campaign:
CPC (cost per click)
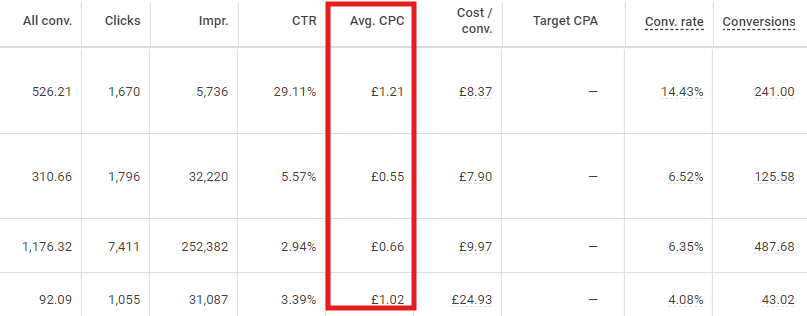
Cost Per Click (CPC) is a crucial performance indicator in Pay-Per-Click (PPC) advertising that measures how much you pay each time a user clicks on your ad. It directly affects your advertising costs and overall campaign effectiveness, making it essential for budget management and achieving a positive return on investment.
CPC is important because lower CPC allows for more clicks within your budget, while high CPC often indicates competitive keywords or less relevant ads. Improving ad relevance and targeting can help reduce CPC and increase visibility.
To use CPC effectively, adjust your bidding strategy to keep costs manageable without sacrificing ad placement. A high CPC with low engagement may indicate a need for better targeting or ad copy. Track CPC alongside conversion rates to ensure your campaigns remain profitable.
To summarise this, optimising CPC helps reduce costs and maintain ad effectiveness, driving better ROI for your PPC campaigns.
CPM (cost per mille)
Cost Per Mille (CPM) is a crucial metric in Pay-Per-Click (PPC) advertising that measures the cost of acquiring 1,000 impressions of your ad. It is particularly valuable for campaigns aimed at brand awareness and visibility rather than direct conversions.
CPM is important because it indicates how effectively your brand reaches potential customers; a lower CPM results in greater exposure. It also helps allocate budgets wisely across channels and offers insights into ad effectiveness. Higher CPMs without engagement may suggest the need for targeting or creative adjustments.
To use CPM effectively, focus on increasing brand awareness, especially during product launches. Combine it with metrics like Click-Through Rate (CTR) to evaluate performance. If CPM is high, refine your targeting or ad creatives to improve relevance.
In summary, CPM is essential for assessing ad impressions, helping manage budgets, optimising strategies, and enhancing brand visibility.
CTR (click through rate) and Interaction Rate
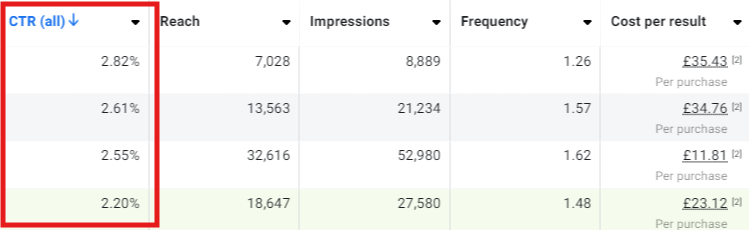
Click-through rate (CTR) represents the percentage of users who click on your ad after seeing it, calculated by dividing the number of clicks by the number of impressions and multiplying by 100. A high CTR indicates that your ad is compelling and relevant, which can improve your Quality Score on Google Ads, potentially lowering your cost per click (CPC) and enhancing ad placement.
To improve CTR, benchmark against industry averages, conduct A/B testing with different creatives and headlines and refine your audience targeting if your CTR is low.
Interaction Rate measures the percentage of users who engage with your ad in various ways, such as clicking, hovering, or watching videos. This metric provides insight into how effectively your ad captures user interest beyond just clicks. A high interaction rate indicates strong user engagement, which can inform future ad strategies. To leverage this metric, evaluate which ad elements drive interactions, tailor engaging content, and compare interaction rates across platforms to identify where your audience engages most effectively.
To summarise this, CTR and Interaction Rate are critical for assessing the effectiveness of your ads. By monitoring and optimising these metrics, you can enhance ad performance, improve targeting, and achieve better campaign results.
Learn more about CTR in our dedicated blog, What is Click Through Rate in PPC?
Conversion Rate
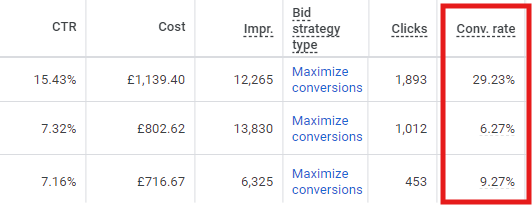
Conversion Rate is a performance indicator in advertising that measures the percentage of users who complete a desired action, such as making a purchase or submitting a lead form, after interacting with your ad, website, or landing page.
It is calculated by dividing the number of conversions by the total number of visitors and multiplying by 100. A higher conversion rate indicates effective marketing efforts and demonstrates campaign success while improving this rate can lead to a better return on investment (ROI) from your marketing spend.
Tracking conversion rates provides insights into user behaviour, helping you identify which elements resonate with your audience. To effectively use this metric, establish conversion goals and conduct A/B testing on different ad creatives and landing pages.
If conversion rates are low, analyse user behaviour to identify possible barriers, such as slow load times to your website, unclear messaging or bad creativity. In summary, optimising conversion rates is essential for enhancing campaign performance and improving ROI.
Search Impression Share (& related metrics)
Search Impression Share (IS) is a metric that measures the percentage of times your ads were shown compared to the total number of times they could have appeared for a specific search query. This metric provides insights into the visibility and performance of your ads relative to competitors. This metric is crucial for evaluating how visible your ads are to potential customers; a low impression share may indicate budget limitations, low bids, or narrow targeting.
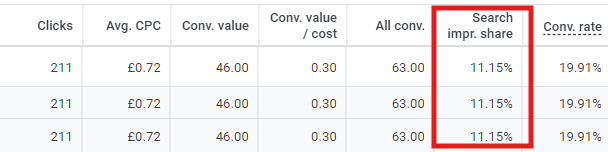
By comparing your impression share with competitors, you can gain insights into your ad’s effectiveness and identify areas for improvement. Additionally, tracking related metrics such as Lost Impression Share (Budget) and Lost Impression Share (Rank) can help pinpoint reasons for missed opportunities. High values here suggest a need for budget increases or better ad quality.
Metrics like Absolute Top Impression Share and Top Impression Share further inform you about your ad’s visibility in top positions on search results pages. In summary, monitoring Search Impression Share and its related metrics is essential for optimising campaign performance and enhancing overall ad visibility.
Cost / Conversion (CPA)
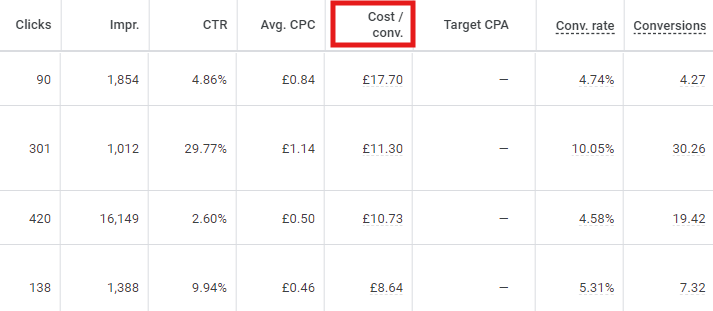
Cost per Conversion, also known as Cost per Acquisition (CPA), is a performance metric that measures the average amount spent to acquire a desired action, such as a sale or lead. In Google Ads, CPA is calculated by dividing the total cost of a campaign by the number of conversions achieved. For example, if you spend £1000 on a campaign and gain 100 conversions, your CPA would be £10.
Monitoring and optimising CPA is crucial for ensuring your advertising budget is spent effectively; strategies such as automated bidding, A/B testing, and refined audience targeting can help improve your CPA and overall campaign performance.
ROAS (Return on Ad Spend), not to be confused with ROI
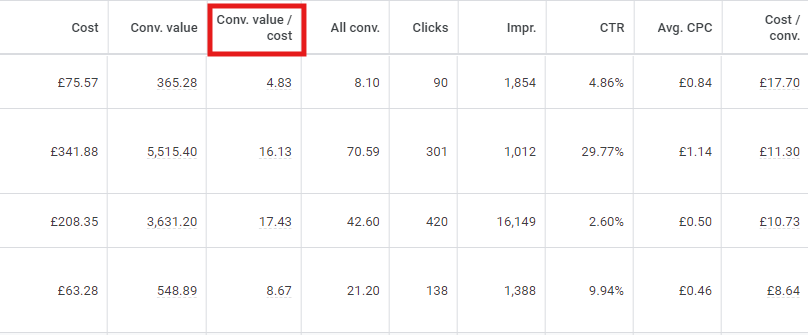
Return on Ad Spend (ROAS) is a crucial metric that measures the revenue generated for every pound spent on advertising, helping to assess the effectiveness of ad campaigns in driving sales and evaluating the overall profitability of marketing efforts. For instance, if you spend £1,000 on an advertising campaign and generate £5,000 in revenue, your ROAS would be 5, indicating that for every £1 spent, you earned £5 back.
A higher ROAS reflects a more effective ad campaign, while a ROAS lower than your break-even point may suggest the need for optimisation. ROAS can be calculated as the ratio of total conversion value to total ad costs, providing a valuable metric for understanding advertising investments and reinforcing the importance of measuring revenue generation against advertising costs.
Now you know all about the key KPIs and metrics in PPC, why not learn more about digital marketing metrics with our GA4 Glossary?

Track Your PPC KPIs with Wildcat Digital
At Wildcat Digital, we specialise in helping businesses maximise the performance of their PPC (Pay-Per-Click) campaigns by carefully tracking and optimising key performance indicators (KPIs) across multiple platforms. We understand that no two businesses are the same, which is why we utilise a combination of advertising channels, including Meta Ads, Google Ads, and other leading platforms, to deliver results that align with your specific goals.
We provide comprehensive tracking and reporting to give you full visibility of your PPC performance across all channels. Our data-driven insights allow you to make informed decisions, ensuring that your advertising efforts are always aligned with your business goals. Let us help you take control of your PPC campaigns, track your KPIs, and achieve measurable results that drive growth for your business.
Get in touch today for a free consultation or to learn more about our PPC services.

Tom Brookes
PPC Executive